
| Date | Price $ | Result % | Candle Name | Side |
|---|---|---|---|---|
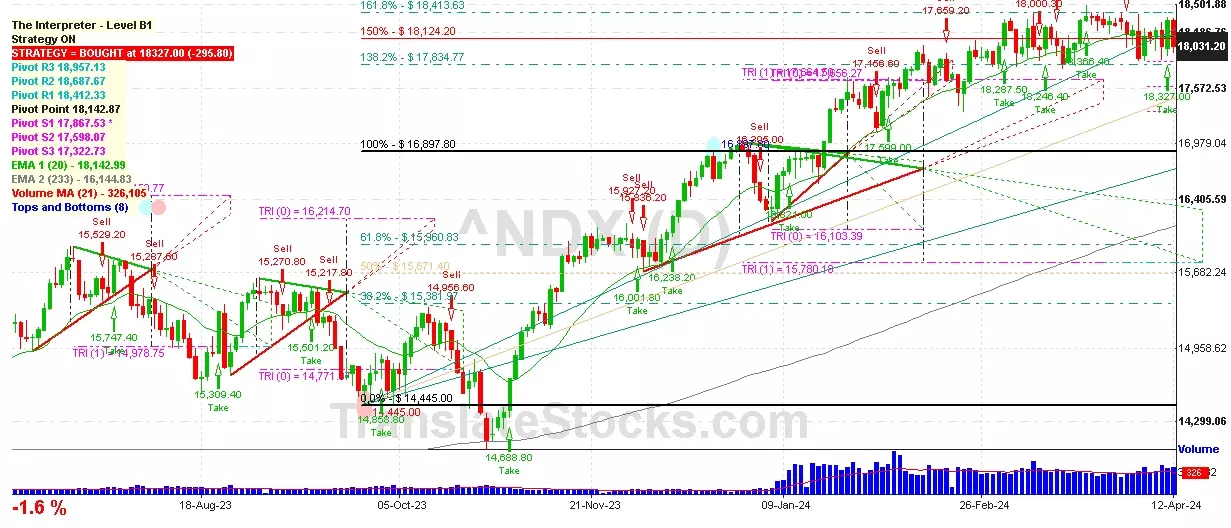
| 001 11 Apr 2024 | Buy Price: 18,327.00 | Loss: Close Day2 ($ 17,735.60) | Engulfing | Buy |
| 002 29 Jan 2024 | Buy Price: 17,595.40 | Loss: Close Day2 ($ 17,156.60) | Engulfing | Buy |
| 003 18 Jan 2024 | Buy Price: 17,000.80 | Profit: Close Day1 ($ 17,347.80) | Engulfing | Buy |
| 004 28 Nov 2023 | Buy Price: 16,012.60 | Loss: Close Day2 ($ 15,927.20) | Abandoned Baby | Buy |
| 005 10 Nov 2023 | Buy Price: 15,521.60 | Profit: Open Day1 ($ 15,532.00) | Engulfing | Buy |
| 006 14 Aug 2023 | Buy Price: 15,222.80 | Profit: Open Day1 ($ 15,223.60) | Engulfing | Buy |
| 007 01 Aug 2023 | Sell Price: 15,724.40 | Profit: Open Day1 ($ 15,640.40) | Engulfing | Sell |
| 008 05 May 2023 | Buy Price: 13,250.10 | Profit: Close Day1 ($ 13,280.80) | Abandoned Baby | Buy |
| 009One Year Average | Both Sides Result for 8 Signals |
Loss: $ -642.70 ($ -80.34 / Signal) |
All of Them | Buy + Sell |

 Click to Enlarge